
CRISPRMED24 Testimonial - Laura...
Jan. 21, 2025

CMN Intelligence - The World’s Most Comprehensive Intelligence Platform for CRISPR-Genomic Medicine and Gene-Editing Clinical Development
Providing market intelligence, data infrastructure, analytics, and reporting services for the global gene-editing sector. Read more...
If you are reading this, by now you are more than familiar with the concept of genome editing and CRISPR/Cas. Over the last weeks, we discussed the main elements to factor in when designing a CRISPR/Cas sgRNA approach and introduced CHOPCHOP as a helpful tool to help up in this regard.
Today we will discuss how we can assess whether CRISPR/Cas did its job: to cut the DNA.
A little warning before we start, this is gonna be a longer article than usual. This is because we need to explain some concepts in more detail, but don’t worry, it’s going to be worth it and, more importantly, it’s going to be fun!
I know, you’re thinking “Hold on, my friend! How did the Cas9 and the sgRNA get into our cells in the first place?”
Glad that you are asking, and we did not forget about it. You see, CRISPR/Cas is delivered to cells in the same way other transgenes, nucleic acid or recombinant proteins are delivered. Meaning using either chemical or electrophysical methods to help the cargo pass the cell membrane.
Even so, “Delivery” is not a trivial issue, and we will discuss it in the near future. For now, suffice it to say that after a smart design of your sgRNA – you can thank us later - and a textbook transfection, we are finally at the point where we want to know whether we managed to CRISPR some cells.
Let’s take the Genetics101 book and go to the page describing that a genetic trait possesses a Genotype – the genetic sequence that codifies it – and a Phenotype – the result in the “observable world” of that genetic sequence -.
As such, the result of a gene editing experiment can be assessed in two ways. We can look at the genetic level -did anything change in the DNA sequence?- or, in case the target sequence codifies for an mRNA or -even better – a protein, we can also look at the phenotype.
Let’s start with the DNA, as this will be the most common and trustworthy approach.
How do we do that? Once a professor told me “In case of doubt, most molecular biology questions can be answered with a Polymerase Chain Reaction (PCR)”.
And this is the case!
Whether you are aiming for basic Sanger sequencing-based approaches or are fancying the latest in Next-Generation Sequencing, make peace with the fact you will need to face the dreadful PCR.
Routinely, we may use three different methods, characterized by an increasing level of sensibility, but they all start from a PCR: Polymorphism-like-Analysis, Sanger Sequencing and NGS-based.
The first step is thus to extract the DNA from the treated cells and amplify via PCR the target sequence. Usually, this procedure entails amplification of an area with a length between 300-nt ( max length for NGS) and 500 nt (recommended length for Polymorphism-like-Analysis and Sanger sequencing) around our target sequence, so that we can study any changes to that region caused by our CRISPR experiment. Very importantly, for all essays, we will want a PCR product coming from the DNA of CRISPR-treated cells, as well as a PCR product from untreated cells, which we will use as a negative control and as a reference sample for assays relying on DNA sequencing.
Now that we have our target sequence amplified as a PCR product, also known as amplicon, it is time to run your assay. We just need to choose which one.
This kind of assay takes advantage of a class of restriction enzymes that can identify and cut bulges present in the DNA structure when two bases in the complementary strands are not complementary and cannot pair with each other. To do this assay, the amplicons of the PCR reaction are heated up to 95-98ºC for a few minutes, which causes the two strands to separate (denature). Then, the amplicon is cooled down to room temperature, which will cause the separate strands to couple again. Interestingly, the strands that were separated are unable to find their original partner and will bind to each other randomly. Since the PCR amplicon comes from the DNA of the different cells in our sample, which will contain a mix of edited and unedited cells, there’s going to be variability in the sequence of our PCR amplicons. Even those DNA molecules with edits may also be different from each other, because the mutations resulting from NHEJ repair are not homogenous, as we described earlier.
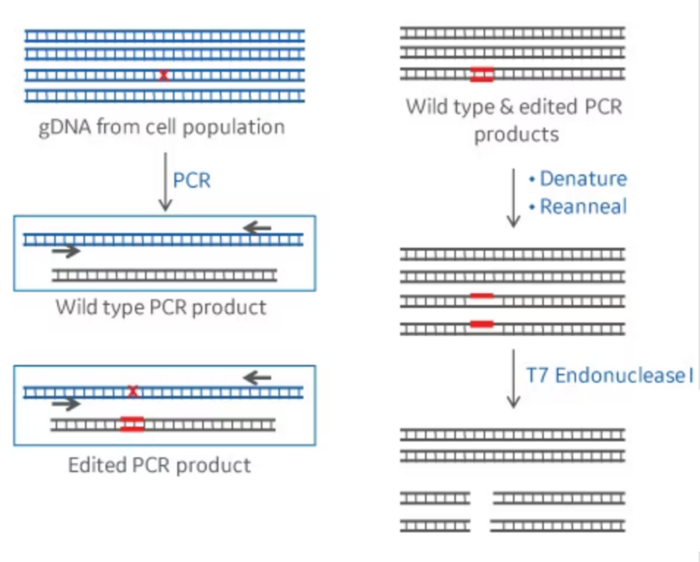
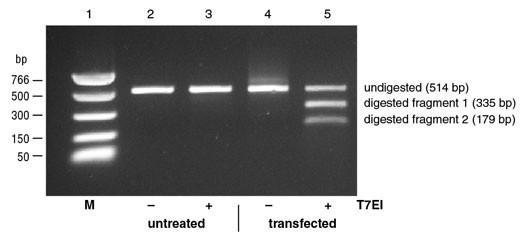
Thus, after denaturation, when the amplicons are forced to quickly reanneal by dropping the temperature, this may lead single-strands from different amplicons to anneal into a double-stranded DNA that is not totally complementary. In this instance, a bulge may form at the position where the DNA strands differ from each other, also defined as a mismatch. DNA bulges can be recognized and digested/cleaved by the restriction enzymes used in this type of assay. When this happens, our 500bp PCR fragments are going to be cut into, for example, a 200bp and a 300bp fragment. If we run this DNA in an electrophoresis gel, we will be able to see these smaller bands. This can provide us with a semi-quantitative estimation of the CRISPR efficiency at that particular target. Editing efficiency can be quantified by imaging the gel and measuring the intensity of the band corresponding to the full-size amplicon (not containing the alterations) and the fragments (resulting from a digested amplicon).
The two main assays used for this are known as the T7E1 assay and the Surveyor assay. Both assays have a similar working mechanism, but they use different enzymes.
While this is a smart way to assess editing efficiency without the need for sequencing, it is cumbersome and not really quantitative. Plus, it may underestimate CRISPR efficiency, when two single-stranded amplicons with the same mutation anneal with each other and do not form a bulge although the mutation is there.
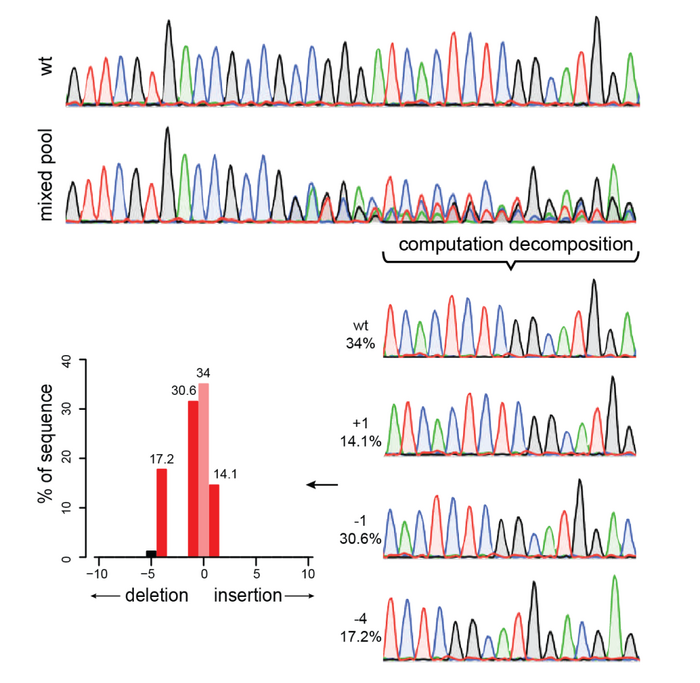
The next type of assay we can use is based on Sanger Sequencing, which allows us to use the same PCR amplicons and, in this case, read their DNA sequence. This sequence is depicted as a series of peaks with four different colors, each one indicating a different nucleotide (A, T, G, and C, of course!). Remember that a PCR amplicon will contain PCR fragments coming from the DNA of hundreds or thousands of cells in our sample. In a PCR amplicon coming from untreated cells (yay, negative controls!), we will see only one clear peak per base, which will show that all cells have the same sequence. Instead, in our CRISPR-treated cells, we will expect to have cells with different edits, as well as unedited cells. If this is true, the peaks around the targeted region should not be uniform. Instead, we will see a series of multiple peaks at the same position. This would indicate the presence of a mixed population, indicative of the successful CRISPR activity.
However, the kinds of peaks we will get are going to be very mixed up, and it would be quite difficult to figure out what they mean. Luckily, software like TIDE or ICE allows us to do exactly this: they accept as input the Sanger sequencing of the untreated sample and the treated one and then they compare the peaks within the two samples. Then, they can find the area where multiple peaks are present and quantify the representation of the different peaks vs the untreated one to determine the percentage of the editing. Yes, it feels like magic, and yes, it’s waaaay too complicated to explain. Just take it and run!
Next-generation sequencing methods like CRISPResso work in a similar way to what we just described, but by using the power of NGS, which can give millions of individual reads, it allows for a more sensitive detection of gene editing. However, compared to Sanger sequencing-based methods, NGS is more laborious and expensive and requires more specialized personnel. Because of their sensibility, NGS methods are particularly useful when investigating rare events, like unwanted CRISPR modifications, the so-called off-targets. But this is a topic for another time!
Nope, we’re not done yet! As we said above, there is another level at which to investigate CRISPR activity, and this is the phenotype.
This is particularly important when we want to KO a gene. While we are interested in seeing which mutations we introduced via using CRISPR, our main interest in confirming that the gene’s activity is indeed gone.
And how do we do that? Well, since a gene codifies for the production of a protein, we can look at the protein level.
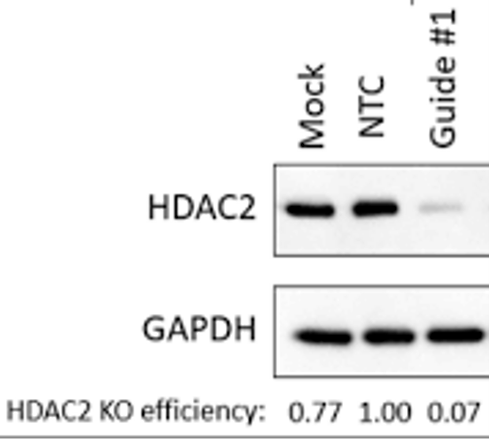
To do this, a possibility is to perform a Western Blot. This ancient (and despised by many) technique uses labeled antibodies to visualize the presence of specific proteins on a membrane. In a successful CRISPR experiment, we would expect the protein codified by our target gene to be absent or much lower compared to the untreated sample.
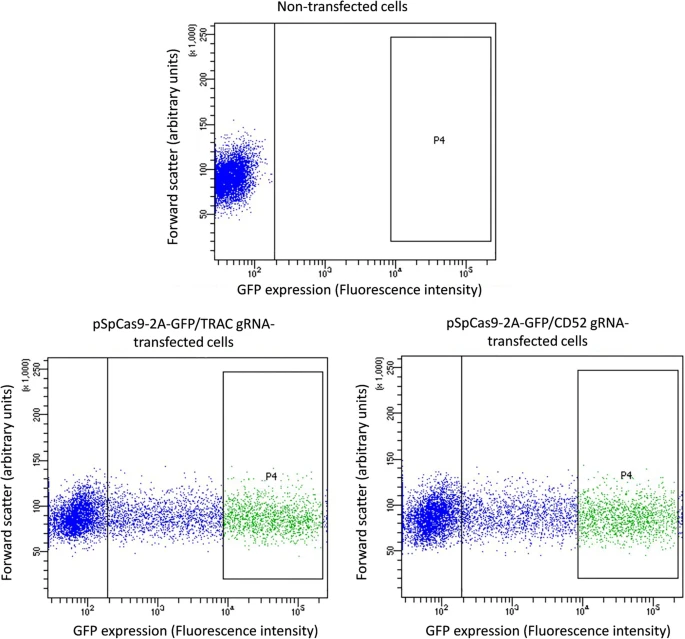
However, this is not the only way we can do this. For example, if a protein is expressed on the surface of the cell, like a receptor, then it may be possible to use Flow Cytometry. In this kind of experiment, we will still use a labeled antibody, but in this case, the signal would be detected not via Western blot but by detecting and quantifying the presence of labeled r cells using a laser-based system. This system will recognize the cells where a labeled (fluorescent) antibody has attached to a surface receptor and can even allow us to separate labeled and unlabeled cells for later experiments. Compared to Western Blot, Flow Cytometry is more quantitative, easier, and faster to perform. However, it can be mainly applied to surface receptors and is not useful for proteins that don’t stick out on the outside of our cells. While there are cell permeabilization techniques that allow us to look at the inner content of the cells, these techniques are more complex and may require some optimization. Sometimes, a Western Blot is actually the best option, unfortunately!
To recap, there are two levels at which to look for CRISPR editing:
- DNA level, where we get an idea of whether or not mutations were introduced (T7E1, Surveyor) and which type of mutations ( Sanger, NGS) we produced.
- Protein level, which tells us if the mutations at the DNA level could impair gene expression and lead to a drop in the corresponding protein level.
Okay, we realize that this was a quite technical and longer article, so in the next episode, we will try to give you a treat by bringing you real-world examples where CRISPR-based KO has been applied to treat genetic conditions and what were the outcomes!
Stay tuned and we will see you in the next one!
To get more CRISPR Medicine News delivered to your inbox, sign up to the free weekly CMN Newsletter here.